In Spotlight A, I talk about four different types of survey:
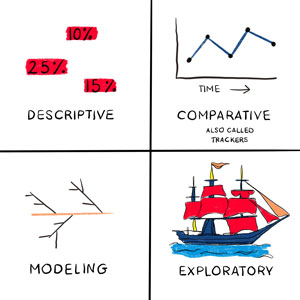
- descriptive
- comparative (also called tracker)
- modelling
- exploratory
This model was inspired by Robert Groves’ book Survey Errors and Survey Costs (Wiley, 2004)
Total Survey Error as a starting point
The Survey Octopus is my way of helping readers get to grips with one of the most important concepts in running and designing Surveys That Work: Total Survey Error. Among the early reading I did that led me to understand the importance of Total Error was an article by Paul J. Lavrakas: ‘Applying a Total Error Perspective for Improving Resarch Quality in the Social, Behavioral, and Marketing Sciences‘, (Public Opinion Quarterly, October 2013, 77(3): 831-850).